Hi this is Team Merchant Navy Decoded !!!

Please fill the below form with your query and we will get back to you in next 12 hours.

Rest assured your data is safe with us !!!🙂

Ask Your Query

Propeller Curve and Engine Load Diagram

If you’ve ever stood in an engine room listening to a big two-stroke diesel hum along, you’ve probably wondered: how do engineers know this engine isn’t being pushed too hard? How do they match it to the propeller so the ship burns less fuel, lasts longer, and doesn’t break down in a storm?

The answer lies in two charts that every marine engineer learns to read like a second language:

  • The propeller curve
  • The engine load diagram

This guide walks you through both, step by step. No jargon without explanation. No fluff. Just what you need to understand how a ship’s engine and propeller work together, and why getting the match right matters for fuel bills, engine life, and safety at sea.

Want to understand main engine performance beyond just the basics? Explore the complete Main Engine Performance package on MND Flix, where you can learn important concepts.


The Propeller Curve

Propeller Curve

A ship’s propeller doesn’t just spin freely. It has to push water backward to move the ship forward, and that takes power. The amount of power the propeller needs depends on how fast it’s spinning.

For a Fixed Pitch Propeller (FPP), this relationship follows a simple rule called the propeller law:

P= c *n^3

Where:

  • P = power absorbed by the propeller
  • n = propeller speed (rpm)
  • c = a constant that depends on the ship, hull condition, and sea state

In plain terms: power rises with the cube of rpm. A small increase in speed means a big jump in power demand.

For example:

  • Increase rpm by 10% → power needed goes up by about 33% (1.1^3 + 1.33)
  • Increase rpm by 20% → power needed goes up by about 73% (1.2^3 = 1.73)

This is why “slow steaming” saves so much fuel, and why even a small rpm increase can push an engine close to its limits.

Plotting the Propeller Curve

When you plot this relationship as power versus rpm, you get the propeller curve. It’s a smooth, upward-curving line that shows how much power the propeller absorbs at any given speed.

Engineers use this curve to:

  1. Compare different engine and propeller combinations on the same chart.
  2. See how the system will perform across many conditions.
  3. Optimise the design before cutting any metal.

Table of Contents

The Propeller Design Point (PD)

The Propeller Design Point is the ideal condition the system is designed around. It comes from:

  1. Theoretical calculations based on hull shape and expected resistance.
  2. Model tank tests under controlled, perfect conditions.

The design point assumes the best case:

  • A clean hull with no marine growth.
  • Calm seas and good weather.
  • A fully loaded ship at its design draft.

This point sits on the light running propeller curve, which represents the lowest resistance. In real service, ships spend very little time on this curve.

The Engine Load Diagram – Where the Engine Can Safely Run

Load Diagram

Think of the engine load diagram as a map with boundaries. Inside the boundaries, the engine is safe. Outside them, you risk damage.

It shows:

  • The power and speed limits for continuous operation.
  • The temporary overload limits (for short periods only).
  • The regions to avoid, like very low-speed running.

Engine Load DiagramEngine Load Diagram

Engine Load Diagram  Engine Load Diagram

Three Key Ideas

  1. MCR / MP point – The Maximum Continuous Rating (MCR), shown as point MP, is the engine’s rated output as written in the ship’s specs. It’s the most power the engine can deliver continuously without hurting its life.
  2. Service points – These are the actual operating points, including power for propulsion and any shaft generator. They normally sit below the MCR line so the engine isn’t constantly run at its ceiling.
  3. Layout diagram vs. load diagram – The layout diagram defines the permissible regions for choosing the engine’s rating. The load diagram defines the limits during actual operation.

Why Low-Speed Running Is Limited

The diagram also restricts running at very low speed. There are five main reasons:

  • Combustion instability – Air and fuel mix poorly, cylinder temperatures drop, and the engine can misfire or knock.
  • Inadequate lubrication – Oil pressure and flow depend on engine speed. At low rpm, bearings and liners can be starved.
  • Turbocharger inefficiency – Turbochargers need exhaust energy. At low load, air supply falls and combustion suffers.
  • Torsional vibrations – At low rpm, the engine and shaft can run near a natural frequency, causing damaging vibrations.
  • Limited PTO power – A Power Take-Off may not get enough power at low speed, so generators and pumps underperform.

Reading the Load Diagram, Line by Line

Reading the Load Diagram

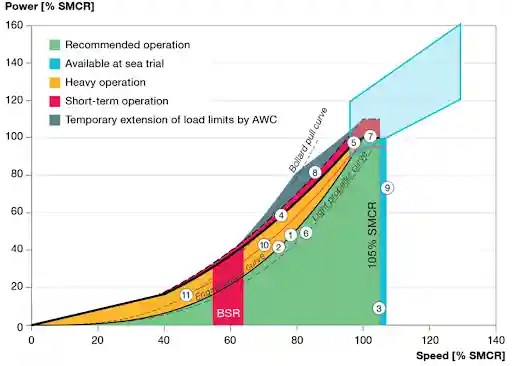
A standard load diagram has eleven numbered lines plus a special area. Here’s what each one means in simple terms:

  • Line 1 – Engine layout curve – Passes through 100% SMCR rpm and power. Coincides with the heavy propeller curve (Line 2). Without PTO, the engine normally operates to the right of this line about 95% of the time.
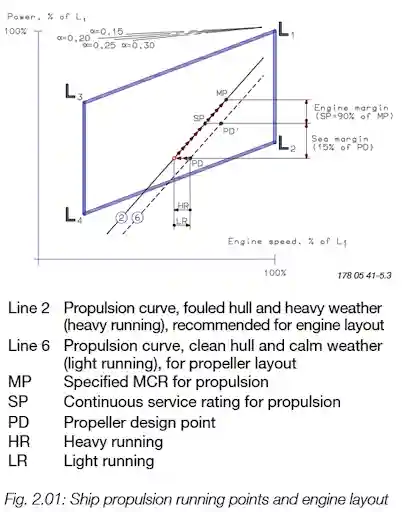
  • Line 2 – Heavy propeller curve – This is the light propeller curve (Line 6) shifted to include a margin for heavy weather and a fouled hull. It’s the curve you design around for real-world service.
  • Line 3 – Maximum rpm for continuous operation – Standard engines can reach up to 105% of rated rpm, or 110% if the engine is speed-derated and torsional vibration allows.
  • Line 4 – Torque/speed limit – Limited mainly by the engine’s thermal load. Crossing it risks overheating and serious damage.
  • Line 5 – Maximum mean effective pressure (MEP) – The limit on average cylinder pressure for continuous operation. Stricter at higher loads and speeds. At lower speeds, Line 4 becomes the stricter limit.
  • Line 6 – Light propeller curve – For a clean hull and calm weather. This is what the layout is initially based on. The light running margin is measured against it.
  • Line 7 – Maximum continuous power – The power limit for continuous operation. Must not be exceeded as rpm increases toward Lines 3 and 9.
  • Line 8 – Overload operation area – Bounded by Lines 4, 5, 7, and 8. Overload is permitted for 1 hour out of every 12, because of the high thermal load.
  • Line 9 – Maximum acceptable rpm (sea trials) – Up to 110% of SMCR or 107% of rated rpm, subject to torsional vibration conditions.
  • Line 10 – PTO layout limit – The maximum combined power of the light propeller plus PTO. Used when dimensioning the system so there is margin to Line 4.
  • Line 11 – Bollard pull propeller curve – The heaviest propeller curve, at zero advance speed, typically 15–20% heavier than the light propeller curve. Matters most for tugs and vessels working at very low speed.
  • AWC area – Adverse Weather Conditions – Extends the overload limits for emergencies. Allows extra power with a heavy propeller for as long as needed. It’s a safety option for severe weather, not normal operation.

Key Terms You'll See Everywhere

  • FPP (Fixed Pitch Propeller) – Blades are set at a fixed angle. Simple, robust, and cheap. Best for ships that run at steady speed and load. Less flexible when conditions change.
  • CPP (Controllable Pitch Propeller) – Blades can rotate while working, so pitch can be adjusted. Gives better efficiency across different speeds and loads, and better manoeuvrability. Common on ferries and tugs.
  • PTO (Power Take-Off) – Diverts part of the engine’s power to auxiliary machinery like shaft generators, cargo pumps, or compressors. Improves overall efficiency, but the engine must be sized for both propulsion and PTO loads.
  • SMCR (Specified Maximum Continuous Rating) – The maximum power and rpm the engine can deliver continuously, as specified by the manufacturer. It’s the reference point for plotting load diagrams. Where SMCR is placed affects turbochargers, cooling systems, and fuel nozzles.
  • Light Running Margin – A safety allowance built into engine–propeller matching to cover lightly loaded conditions, such as ballast voyages or calm weather. On the diagram, it’s the percentage rpm difference between the light propeller curve and the heavy propeller curve.

Real-World Factors That Move Your Operating Point

The Fouled Hull: Silent Power Thief

The Fouled Hull Silent Power Thief

Once a ship is in service, marine growth like algae and barnacles settles on the hull and propeller. Sea trials are done on a smooth, clean hull, so even light fouling afterwards matters.

  • Roughness raises hydrodynamic resistance.
  • To keep the same speed, the engine must produce more power, or the ship slows down.
  • The propeller has to produce more thrust, so the engine runs heavy. This is called Heavy Running (HR).
  • Fuel consumption rises, efficiency falls, and operating costs climb.

On the load diagram, fouling shifts the actual propeller curve toward the heavy side. The engine then runs closer to its torque and thermal limits, which accelerates wear and shortens engine life. Regular hull and propeller cleaning, plus good anti-fouling coatings, are among the cheapest ways to protect an engine.

Fouled HullFouled

Sea Margin: Planning for Bad Weather

Planning for Bad Weather

Headwinds and large waves raise ship resistance significantly. To hold service speed in those conditions, extra power must be available. Designers build this in as the sea margin.

  • It is typically 15% of the Propeller Design (PD) power.
  • On the diagram, Line 6 is calm weather and Line 2 is heavy weather.
  • It improves safety, because the ship can keep operating in varying sea states, and reliability, because it prevents overloading in adverse conditions.

Some sources quote slightly different figures, like a 10–15% reserve relative to MCR. What matters is the principle: a deliberate power reserve for rough seas, hull ageing, and shallow water.

Designing for Heavy Running

Designing for Heavy Running

If you lay out the engine only for ideal conditions (Line 6, light running), it may be fine on delivery day and struggle a year later. For ships that face harsh conditions or long voyages, the better approach is to lay out the engine against the heavy propeller curve (Line 2), which allows for:

  • Fouling over time.
  • Adverse seas, head seas, and currents.
  • Extra displacement or weight.

The benefits:

  • Better long-term durability.
  • The engine copes with high-load conditions without sitting near its limits.
  • Lower risk of derating or emergency shutdowns.
  • Less downtime and more reliable propulsion.

You accept slightly more conservative design assumptions up front in return for fewer problems in service.

Heavy Running vs. Light Running at a Glance

Aspect

Heavy Running

Light Running

Cause

Higher propeller resistance: fouling, bad weather, extra displacement

Lower resistance: clean hull, calm sea, ballast/light load, or a propeller mismatch

Engine behaviour

Higher torque at a given speed; engine may not reach rated rpm

Higher rpm than expected at lower torque

Risks

Overload, thermal stress, wear, higher fuel use

Poor combustion and long-term damage if the mismatch persists

Design response

Heavy propeller curve (Line 2), sea margin

Light running margin

Load Diagrams for Different Plant Configurations

Load Diagrams for Different Plant Configurations

The shape and limits of the load diagram change with the propeller and PTO arrangement. Six common setups:

  • FPP + PTO, increased SMCR power, rpm-extended diagram – For demanding vessels like icebreakers and heavy-lift ships that need more power and auxiliary output.
  • CPP without PTO – Pitch adjustment improves fuel efficiency and manoeuvrability. Typical of ferries and tugs.
  • CPP with PTO – The diagram must account for both variable propeller load and auxiliary extraction. Suits research vessels and offshore support vessels.
  • FPP without PTO – The simplest case. All engine power goes to the propeller on a standard fixed curve. Common on conventional cargo ships and tankers.
  • FPP with PTO – The engine must be sized for propulsion plus auxiliary loads. Common on reefer ships and some container vessels.
  • FPP + PTO with increased light running margin – Extra margin protects the engine from excessive speed or overload in light conditions. Suits cruise ships and ferries, where load changes are frequent.

Frequently Asked Questions (FAQs)

A graph of engine power or torque against speed that shows safe, overload, and underload zones, so engineers can keep the engine properly matched to the propeller load.

Waves and wind raise resistance and propeller load, demanding more torque. Unmanaged, this pushes the engine into overload zones, increasing wear and fuel use and cutting safety margins.


Thermal overload, accelerated wear on bearings and gearboxes, and potentially catastrophic failure, with unplanned downtime and costly repairs.

They catch early signs of wear, load imbalance, or abnormal behaviour. Tracking load, speed, vibration, and fuel consumption allows timely maintenance and prevents breakdowns.


  • Regular hull and propeller cleaning.
  • CPPs for load optimisation.
  • Engine tuning and load management.
  • Real-time performance monitoring.
  • Preventive maintenance and proper engine–propeller matching.

Disclaimer :- The opinions expressed in this article belong solely to the author and may not necessarily reflect those of Merchant Navy Decoded. We cannot guarantee the accuracy of the information provided and disclaim any responsibility for it. Data and visuals used are sourced from publicly available information and may not be authenticated by any regulatory body. Reviews and comments appearing on our blogs represent the opinions of individuals and do not necessarily reflect the views of Merchant Navy Decoded. We are not responsible for any loss or damage resulting from reliance on these reviews or comments.

Reproduction, copying, sharing, or use of the article or images in any form is strictly prohibited without prior permission from both the author and Merchant Navy Decoded.

DIWALI SALE

Decoded Discount Alert! up to 50% OFF

DIWALI SALE

Decoded Discount Alert! up to 50% OFF

Use Coupon Code Deep50

Days
Hours
Seconds
0
Would love your thoughts, please comment.x
()
x